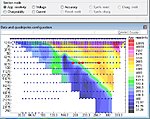
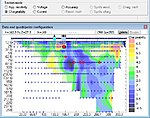
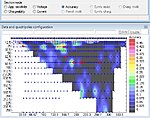
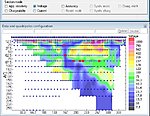
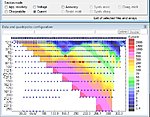
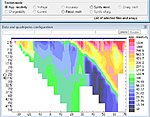
There are two common parameters that characterize obtained ERT data: apparent resistivity and chargeability. The most common way to visualize such data is plotting pseudosections, i.e. map of the parameter in (Distance-Spacing) axes.
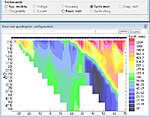
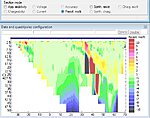
There are other parameters that characterize the field data also, such as Voltage, Current or Accuracy. The presentation of these parameters is less common. However, their use allows to analyse the ERT field data also.
The user of x2ipi could view and analize field data using specified parameters:
The user of x2ipi could view and analize field data using specified parameters:
Write first comment