Practical example of ERT field data analysis with x2ipi software.
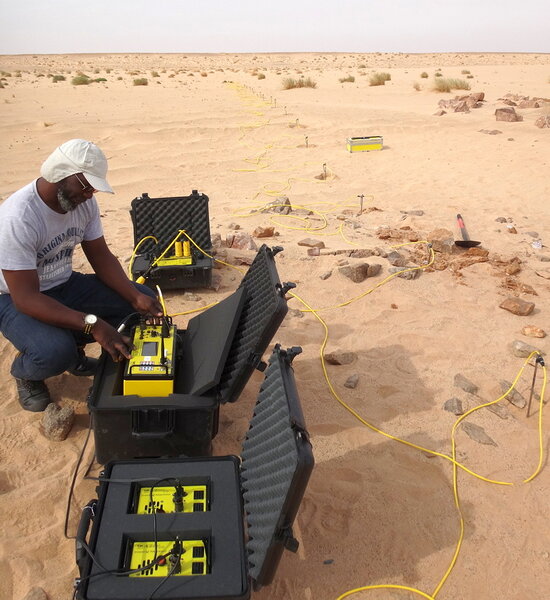
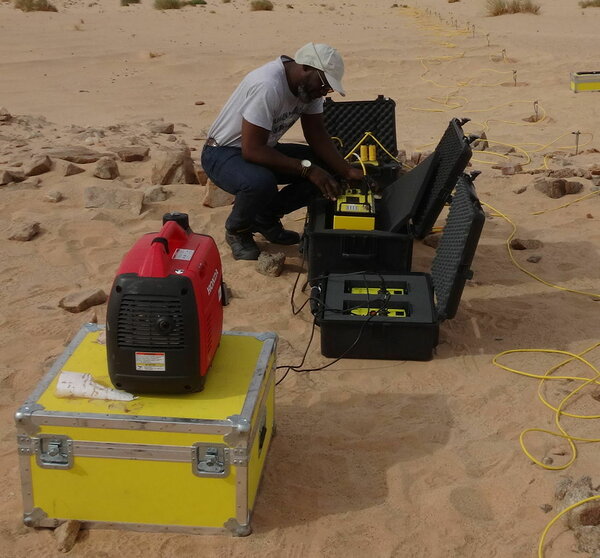
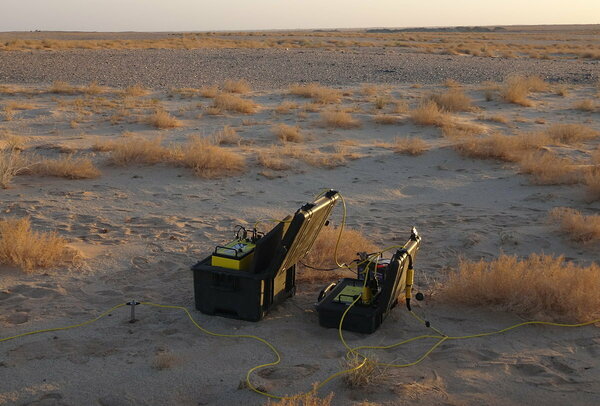
The field data were from SuperSting R4 unit. It was
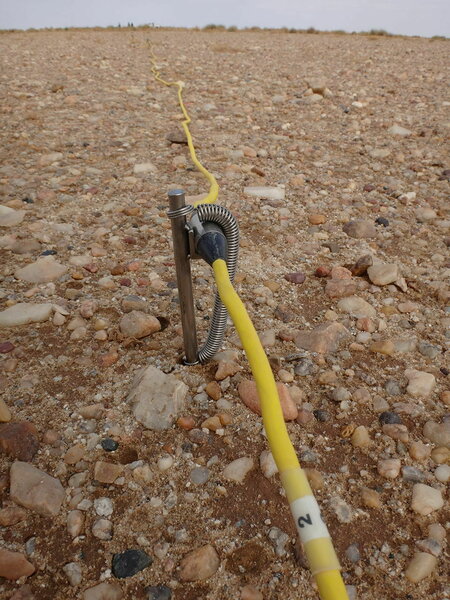
Schlumberger array. Ground resistance was good and AB current was from 90 up to 300 mA. You can download a STG file from here. Inter-electrode distance was 3 meter.
| Apparent resistivity, Ohm.m | |
| Measured voltage, mV | |
| AB current, mA |


[D-transf] button shows the difference between two data set in percent. We see that maximal data error corresponds to the maximum spacings and minimal measured voltage. We can see also dependence data error on one plot, but it need some manipulation.

- Menu-Load-Make control. It saved the file "2901G.ctrl.txt", which keeps all duplicate readings.
- This file keeps apparent resistivity and voltage if it is available in data file.
- We can calculate data error and plot the results.

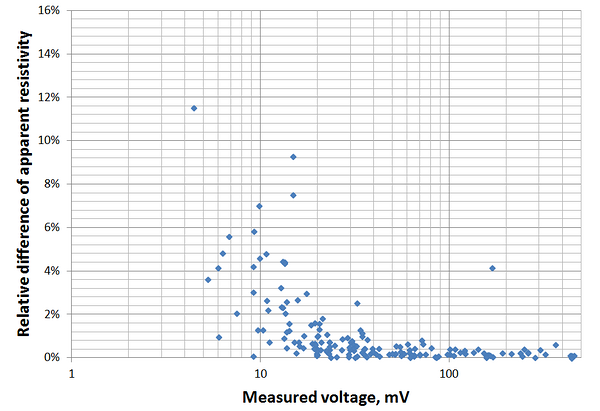
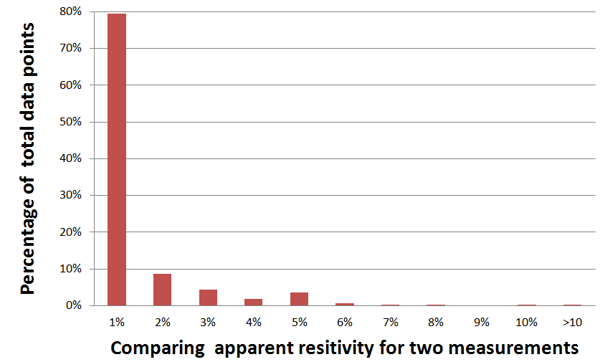
- The field data has good accuracy.
- Minimum required voltage is about 10 mV.
Write first comment